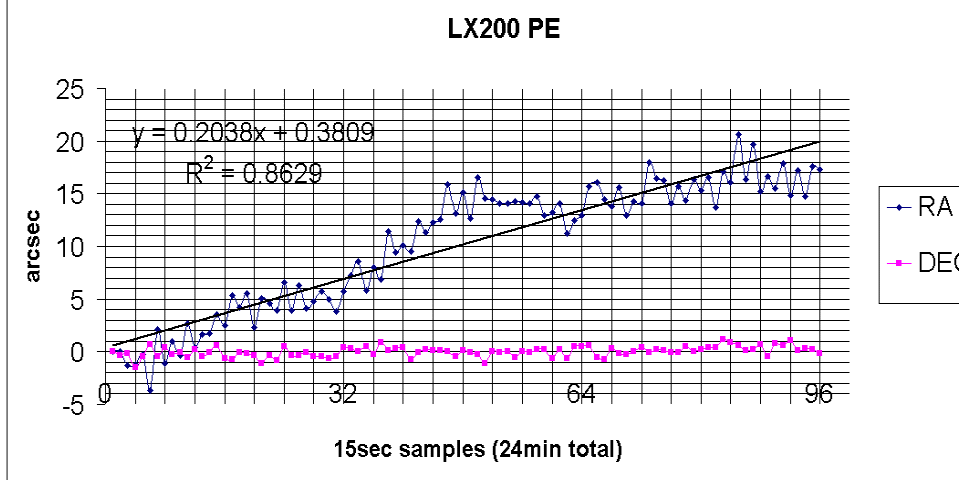
Update 9/17/2002 on lx200 PE after a 'good' learn/update cycle
Images were taken every 15 seconds (total of 96 = 3 worm cycles)
Total RA drift = 17arcsec
Total DEC drift = 0.78arcsec/24minutes
I am not sure where the the non-linearity comes from, but at these levels it
is basically a 'do not care'.
There is one place in the cycle that could use a slight tweak, namely at
samples 6-7, 37-38 and 72-73. But there is also a good chance I could goof
it up as it is not exactly symmetrical in the worm cycle so for now will
leave well enough alone :)
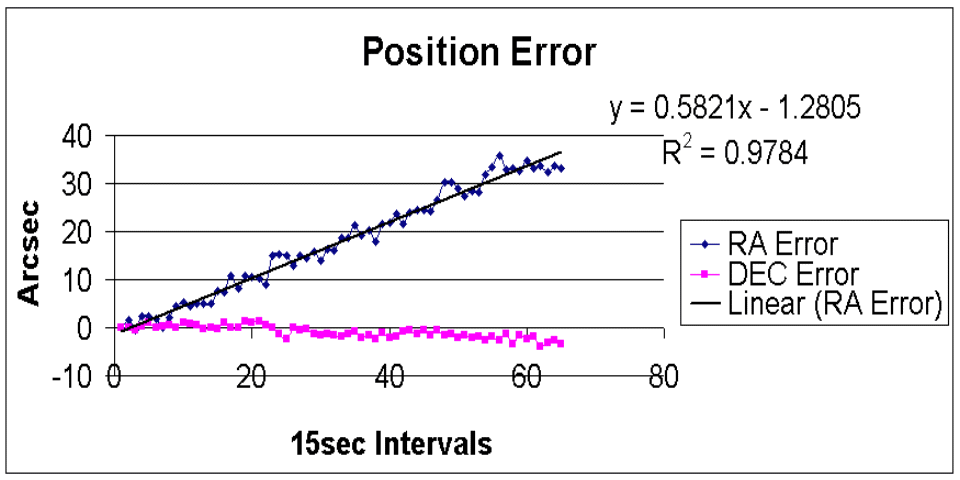
Compare with the previous work:
The following shows two worm cycles of the periodic error of my lx200 after a
'learn' and an update cycle.
Could be better but not extremely bad.
But there is a catch, scroll down to the second graph!
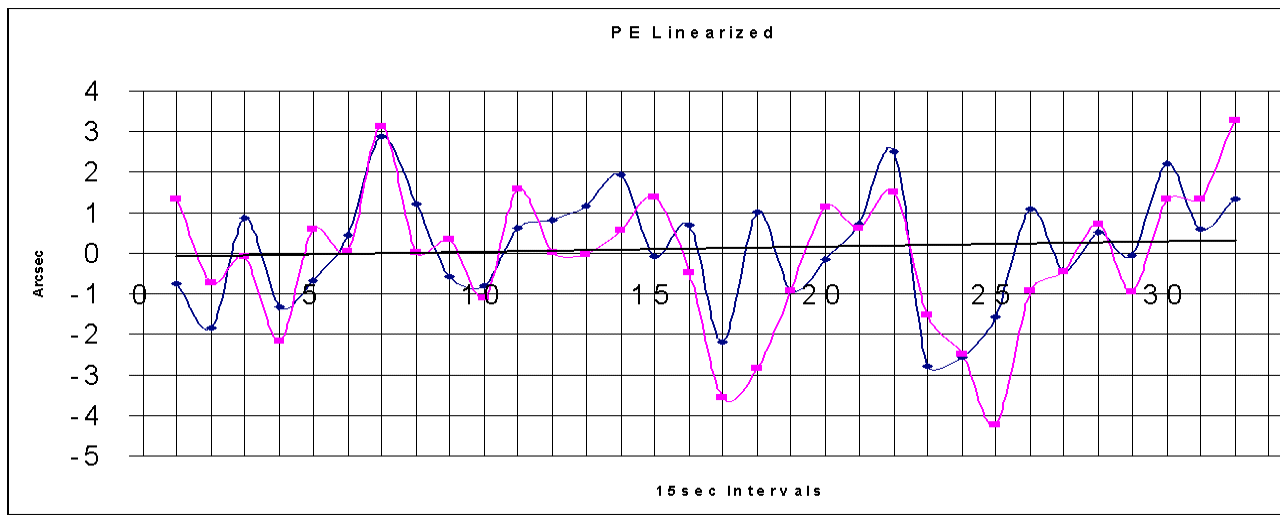
The second graph shows the actual data measurements in time.
The data was generated by taking an image every 15 seconds for 16 minutes.
The resultant frames were then registered in IRIS and the "shift.lst"
file that IRIS generates was then brought into Excel, offsets converted
to Arcseconds and graphed.
A linear trend was applied and the resultant equation was then used
as the 'carrier' data. The actual data then had the value of the 'carrier'
for that sample point subtracted which left the PE after the PEC training.
Not a pretty sight!
Even with this nasty looking graph, the total drift over 16 minutes
was only 37arcsec!
The drift in DEC was 1arcsec in 5minutes (yes could be better!)